Features
Equipment & Systems
Paper
Sensor strategies: Calibration and correlation on the paper machine
Achieve accuracy with the proper calibration and correlation of online paper machine sensors
June 22, 2020 By Martin Fairbank, PhD
 Papermakers using online sensors should have a strategy to correlate sensors. Photo: ABB
 Online sensors are important for the modern papermaker because by continuously measuring product properties, they make it possible to react almost instantaneously to process changes, either by operators or by automated process control.
While equipping a mill with online sensors requires an initial capital expense, this is usually repaid quickly as off-spec product is reduced and faster grade changes are enabled.
In most cases, online sensors modify the role of lab testing from the primary method of quality assurance to a new responsibility of ensuring that the sensors continuously provide accurate measurements.
Key to ensuring that online sensor measurements match offline measurements generated by mills’ quality labs is the practice of dynamic sensor correlation, which is leading many pulp and paper mills to establish a correlation strategy.
“It’s important to appreciate that sensor calibration and sensor correlation are different. Calibration generates precision and sensor correlation generates accuracy.”
Lu Athnos, service account manager for ABB, has more than two decades working directly with papermakers and also currently serves as leader of the TAPPI Common Interest Group on Sensor Correlation.
A large part of her role involves helping customers to create a sensor correlation strategy by ensuring their online sensors can produce accurate measurements and that lab measurement methods follow industry standards.
“Calibration requires a comparison between a calibration standard and the measurement made using your instrument,” says Athnos. “Put simply, the calibration process compares an instrument’s output against primary standards and ascertains their relationship.”
As an example, Athnos cites the calibration of an online caliper sensor comparing its response to one or more traceable standards with known thicknesses. “Once the initial calibration is completed, a set of primary standards can be used to verify the stability and repeatability of the sensor,” she says. “Monthly checks are often performed.”
Athnos adds that, importantly, an online sensor needs to be properly correlated with lab measurements over time. This involves comparing online sensor measurements regularly with offline measurements from the quality control lab.
While undertaking sensor correlation, “expected deviation limits” should be established to objectively quantify the control limits between lab and online measurements. “The expected deviation derives from three main sources: sensor accuracy, process variation and lab test accuracy,” says Athnos.
“Sensor accuracy should be specified by the sensor manufacturer. Paper properties vary constantly during manufacturing and therefore, during correlation tests, it is neither possible nor practical to collect a sample from the exact spot the sensor is measuring. The influence of process changes must be considered. Lab influences can include factors such as sampling error, instrument accuracy, instrument sensitivity and sample conditioning errors.”
Various methods exist for sensor correlation. For example, for basis weight, these methods include:
- Roll weight or reel weight: calculating basis weight from the lineal footage, trim width and weight of a reel or a roll and comparing to the basis weight shown on the reel report of the quality control system.
- Single-point dynamic: placing the sensor in single-point mode and comparing results against lab measurement of samples cut from the reel at the same position across the reel.
“It’s important to appreciate that sensor calibration and sensor correlation are different,” says Athnos. “Calibration generates precision and sensor correlation generates accuracy.”
Case study
A U.S. mill specializing in packaging could not achieve repeatable coat-weight correlation results between its lab and online sensors. While operators expected a deviation of up to 0.5 lbs/3,000 ft2, they in fact observed up to 10 times this level.
They initially believed that the problem derived from the online sensor, but further research established that the machine’s high process variability and inconsistent lab test results were the root causes.

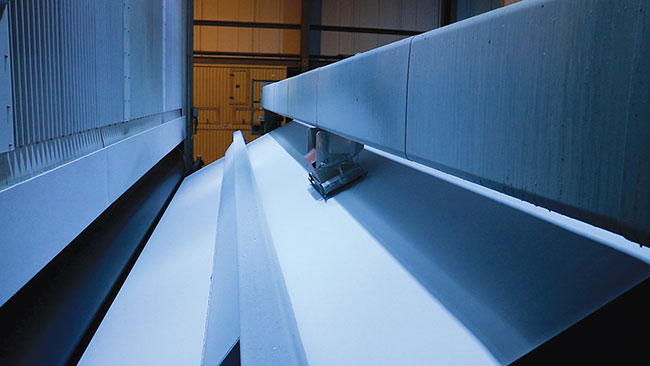
The layout of online sensors on a coated paper machine. Photo: ABB
Process variability
Two online scanners (measuring basis weight before and after coating) were placed in “single-point mode,” following which, basis weight measurements were collected.
There was short-term basis weight variability of approximately 5 lbs/3,000 ft2 between the maximum and minimum values. However, in under a week, having resolved an upstream process issue, the basis weight variability was significantly reduced, down to 1.3 lbs/3,000 ft2.
This confirmed that the process variability was affecting the correlation results.
Lab variability
Operators analyzed lab variability by taking cross-direction and machine-direction samples measuring one by three inches and weighing about 13 grams from three locations on the reel: front, middle and back. The intention was to investigate how repeatable the lab results were from these adjacent paper strips. The lab tests showed variation of up to 2 lbs/3,000 ft2 of coat weight between the samples. To decrease variability, larger samples were recommended to reduce the effect of random lab and sampling errors and provide improved accuracy.
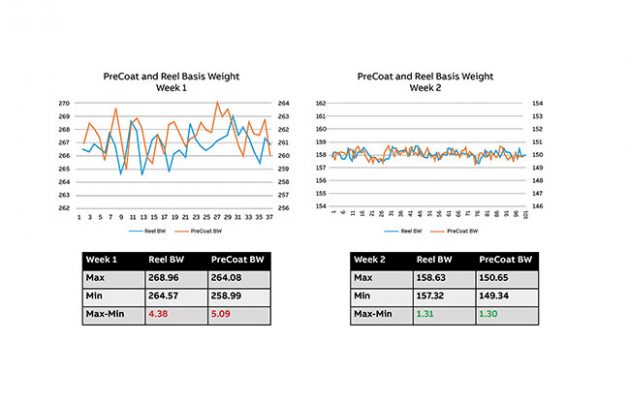
Coat weight variation before and after correcting an upstream process variability issue. Photo: ABB
Results
The paper manufacturer was surprised to find that responsibility for inconsistent correlation results was not due to its online sensor.
Helpfully, the project opened discussions on how to improve machine-direction control for coat weight, subsequently enabling savings in coating usage: if reducing coat weight by 0.5 lbs while maintaining high product quality is possible, the manufacturer could make 4.1 per cent coating material savings.
Some other reasons commonly found for poor correlation between lab and online measurements include not following TAPPI or PAPTAC measurement standards, not protecting paper samples immediately by sealing them in a plastic bag, since paper is hygroscopic, or not measuring the correct side of the paper for measurements that are affected by two-sidedness.
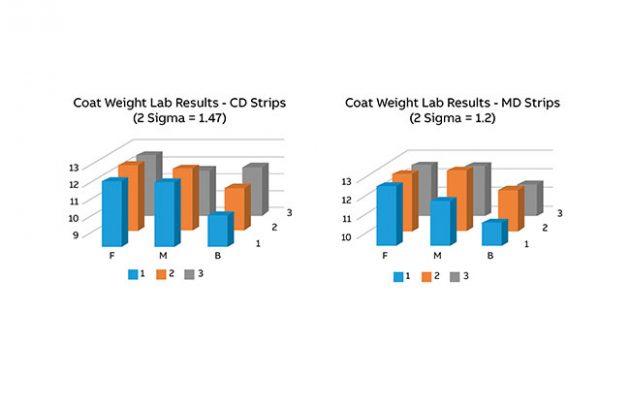
Coat weight from lab results on cross-direction (CD) and machine direction (MD) paper samples taken from front, middle and back (F, M, B) of paper reel. Photo: ABB
Sensor correlation strategies
Every papermaker using online sensors should have a robust sensor correlation strategy, which should audit the sensor correlation processes and methods in order to improve the accuracy of quality measurements. Correct standard operating procedures should also be established.
Athnos and her team have helped dozens of mills align measurements from online sensors and the quality control lab.
As Avery Bolton, quality process engineer at Domtar Hawesville, and a customer of ABB’s Sensor Correlation Service, says, “A strong correlation program […] is critical to operations that trust sensor measurements to make real-time decisions affecting the machines and production. Operators rely on scanner measurements to determine when they are ‘on grade.’ When there is little difference between the scanner and lab results, we can make quick decisions with confidence.”
Using online sensors with proper sensor correlation improves quality measurement accuracy, and can produce significant savings in raw material usage and improved efficiency by reducing off-spec product and energy consumption.
A thorough sensor correlation program is essential for all papermakers to ensure product quality and business profitability.
Martin Fairbank has worked in the pulp and paper industry for over 30 years and is currently a consultant and technical writer.
This article originally appeared in the Summer 2020 issue of Pulp & Paper Canada.
Print this page